VIIIINTERPOLATIOMMXXV · 2025
Daily interpolation of quarterly GDP
 Tab. VIII
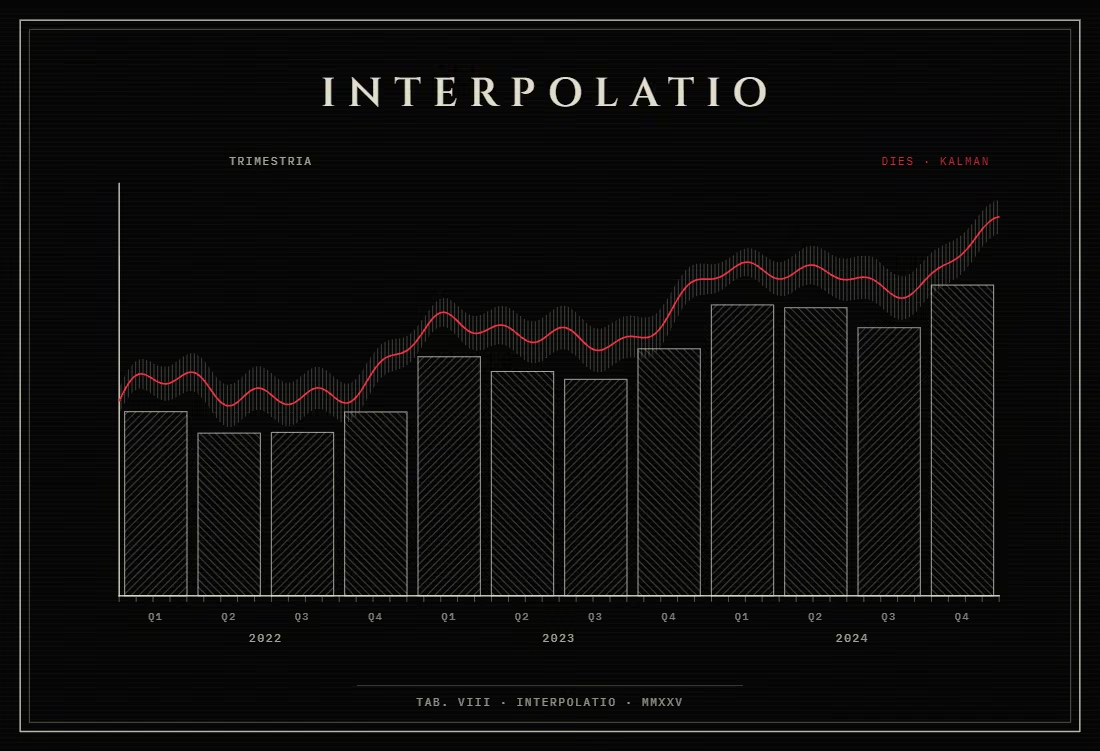
Quarterly GDP spread across the days, with the days still adding up exactly to each quarter.
Brief
Macroeconomic data run on different clocks. GDP is published by the quarter, CPI by the month, policy rates whenever they change, bond yields and oil prices every day. Before they can share a model, they have to share a time axis.
Process
Most of the work was in the data. Chinese statistical tables came in UTF-8, GBK and GB18030; wide tables had to become long ones; policy rates had to be rebuilt as daily series from their announcement dates, and intermediate variables such as credit spreads derived.
Three routes to daily GDP were tried. Linear interpolation is the readable baseline. The main line is a state-space model: GDP’s level and trend are hidden states, the quarterly figure is observed only at the end of each quarter, and daily variables such as oil, government bond yields and the dollar index enter the trend equation. Kalman smoothing estimates every day, and a proportional Denton adjustment makes the days add up to their quarter. Chow–Lin disaggregation is there for comparison, and its code notes that it is still experimental.
Outcome
This is a modelling study, not a monitoring system in service. The Chow–Lin route hasn’t been fully validated yet and shouldn’t be relied on.